

When someone opens a complicated spreadsheet in a meeting, “creative” or “people-oriented” professionals feel a certain dread. You know how it feels. There are an infinite number of rows. The typeface is very small. There are a lot of acronyms going around, like “MoM” and “YTD”. You lose focus. You nod in a polite way. You don’t want anyone to ask you what the numbers in Column G mean.
You could get away with this for a long time. You might say, “Oh, I’m not good with numbers.” “I go by my gut feeling,” or “I’m a words person.” That will kill your career in 2026.
The hard truth is that “data” is no longer a job title. It is a tongue. You don’t have to be a Data Scientist. You don’t have to know how to code in Python or make Machine Learning models. But if you work in Marketing, HR, Sales, or Operations and can’t read a dashboard or figure out a trend, you’re in the dark.
The good news? The bar isn’t as high as you think it is. You don’t need to have a PhD in statistics. You just need to stop being scared of the spreadsheet. This is the practical guide to the “Lightweight Data Skills” that will make you an important part of the team and maybe even get you a raise.

1. Excel: The Tool You Love to Hate
Put the fancy AI tools away for a moment. Excel is still the most important program in the world. You are wasting time if you are waiting for the Data Team to make a report for you. You have to be willing to get your hands dirty.
You don’t need to know how to use macros or VBA. You only need to know the “Holy Trinity” of Excel skills:
- VLOOKUP (or XLOOKUP): This is just linking two lists together. You can combine two sheets if one has a list of employee IDs and the other has their pay. If so, you’re already ahead of half the people in the office.
- The magic button is the Pivot Table. It takes three clicks to turn 10,000 rows of messy data into a clean summary table. You are doing it wrong if you are adding up numbers by hand with a calculator.
- Conditional Formatting: This makes you look smart. It changes bad numbers to red and good numbers to green on their own. It helps you find the problem right away.
The goal is to stop using Excel as a place to keep lists and start using it as a place to ask questions.
Similar More: Cold Email to Hiring Manager: How to Skip the “Apply Now” Button and Get Hired
2. Data Visualization
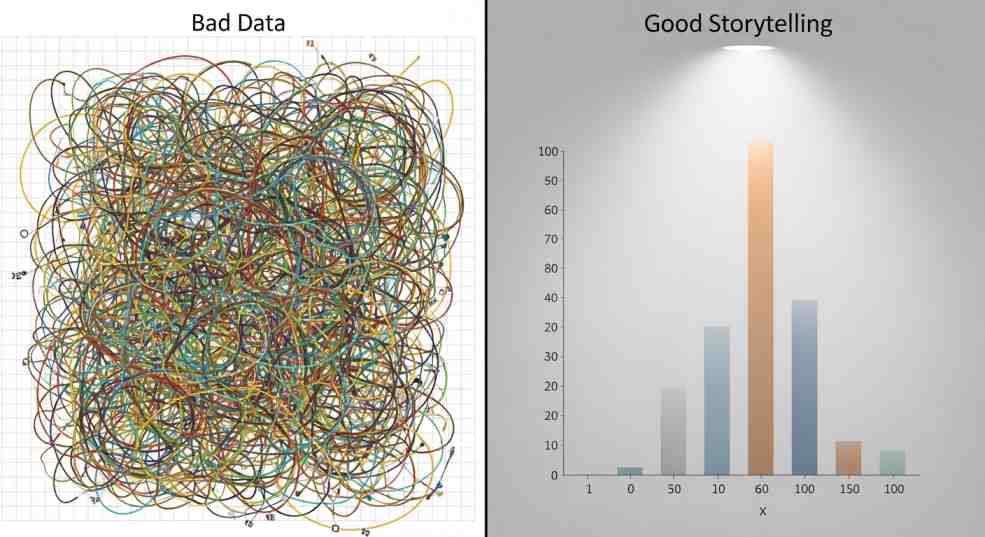
A lot of people think that “data visualization” just means making a nice chart. Not true. It means telling stories.
You failed if you put a slide on the screen with 15 different bar charts. No one knows where to go. Someone who isn’t technical but knows how to work with data knows how to get rid of the noise.
- The “So What?” Test: Each chart should have a title that tells what the conclusion is. Don’t call the chart “Sales Q1.” Put this on the title: “Sales Dropped 10% Because of Shortages in Inventory.”
- Don’t use a rainbow as part of your color strategy. Use gray for everything else and a bright color, like blue or orange, for the one thing you want the boss to see.
You are the one who translates. The information is in its original language; your job is to turn it into English for the people who make decisions.
3. TMetric Definition
This is where the “Business” people really outsmart the “Data” people. Data scientists can get numbers, but they don’t always know how they fit into the business. You do.
You need to know what the numbers really mean.
- HR: Don’t just keep track of “turnover.” Keep an eye on “Regrettable Turnover,” which is when good people leave.
- Marketing: Don’t just keep an eye on “Clicks.” Keep an eye on the “Conversion Rate,” which shows who really bought something.
- Sales: Don’t just keep an eye on “Revenue.” Keep track of “Sales Cycle Length,” which is how long it takes to close.
You are in charge of the strategy if you can tell us what to measure. The person who sets the KPI (Key Performance Indicator) is the one who decides what success is.
4. Basic SQL
Don’t worry, okay? I know I said “Non-Technical,” and SQL sounds scary. But SQL, or Structured Query Language, is really easy. It’s a lot easier than learning Spanish or French. It’s basically writing English sentences to talk to a database.
Why should you learn it? You have to email the Data Analyst, fill out a ticket, and wait three days to get data right now. You can find the answer yourself in 30 seconds if you know the basics, like “SELECT * FROM sales WHERE date = ‘today’.”
You don’t have to be an expert. You only need to know how to “read” the database. It’s like knowing how to make a sandwich instead of ordering takeout. One makes you able to take care of yourself.

5. Critical Thinking
You can’t learn this skill in a bootcamp, and it’s the most important one. Data can be false. Easily.
- “Our average salary is $100,000!” (But the CEO makes $10 million and everyone else makes $30,000.) The average is not right. You should ask for the middle number.
- “Sales are up 200%!” (But you only sold 2 units last month and 6 units this month. The number is not right.
If you’re not a techie, your job is to be the Skeptic. If someone shows you a graph that looks too good to be true, ask,
- “Where did this data come from?”
- “What isn’t there in this view?
- “Is this a link or a cause?” (Just because shark attacks and ice cream sales both go up in the summer doesn’t mean ice cream
Others: Work Pressure कैसे Handle करें बिना पागल हुए
6. Why This Matters for YOUR Career
You might be saying to yourself, “I’m a writer, an HR manager, or a sales rep. I’m good at what I do.” Why do it?
Because Budget speaks Data.
- You can’t just say “we are overworked” if you want to hire someone new. You have to show how many hours were spent on each project.
- You can’t just say “it’s a cool idea” if you want to start a new marketing campaign. You need to show what the expected return on investment (ROI) will be based on past data.
The person who has the data wins the argument. Always. You lose if you go into a meeting with an opinion and your opponent has a spreadsheet.
Final Thoughts
You don’t have to like math. You don’t even have to be good at math in your head. You only need to be interested. Stop seeing data as “homework” and start seeing it as “proof.”
Start out small. Instead of adding things up by hand, try using a Pivot Table the next time you open Excel. When you see a chart again, ask it one hard question. The goal isn’t to turn into a robot. The goal is to make people smarter.
FAQs
Q: Do I really have to learn SQL? It sounds scary.
A: You don’t have to, but you should want to. You should know how to change a flat tire if you know SQL. You can wait three hours for AAA (the Data Team) to show up, or you can do it yourself in 15 minutes and get back on the road. You don’t need to be a mechanic; you just need to know the basics so you can help yourself.
Q: I’m not very good at math. I mean, I count on my fingers. Is there no hope?
A: Don’t mix up “Arithmetic” with “Analysis.” You can do 435 x 12 in your head. When you see a line going down, you ask “Why?” The computer does the math for you. The calculator is Excel. You don’t have to be a human calculator; you have to be a detective. You can do this job if you can see a pattern.
Q: Why not just get ChatGPT to look at the data for me?
A: Yes, you can and should. But AI is like an intern who is very sure of themselves. It will give you an answer, but sometimes it sees things that aren’t there or gets the context wrong. You won’t know when the AI is lying to you if you don’t know the basics, like what a Pivot Table does. You have to be smart enough to check the robot’s facts.
Q: Which tool should I learn first?
A: None of them: Python, Tableau, or PowerBI? Learn how to use Excel first. Everyone wants to use the cool tools, but 95% of businesses still use spreadsheets. You shouldn’t even try to write Python code if you can’t do a VLOOKUP. First, walk.
Q: What should I do if I can’t get to my company’s data?
A: Get your own life. Get your bank statement in CSV format. Get a copy of your Netflix viewing history. Look into that. “Last month, how much did I spend on tacos and coffee?” “Which day of the week do I watch the most TV?” The skills are the same; the data is different. It’s also fun to see your own habits on a chart.